
Monitoring
7 May 2017 · Filed in InfrastructureOur team run morning checks every day to ensure the development environments have been deployed successfully from our automation schedule. The quickest indicator is a dashboard using dashing and uchiwa which has a tile for each role in the environment with a helpful red or green status. Of course if it isn’t green, the team then go to diagnose why and quickly resolve the build error(s).
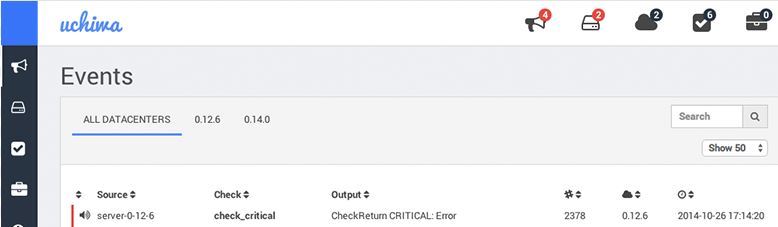
Monitoring with Uchiwa
This dashboard is made possible by having smoke tests on each server, reporting back to sensu, without this vital step, my support guys would be blind.
There is a project for Sensu that provides a range of plugins. Cpu, memory, disk, http request, export to Graphite and ‘many more’.
You can of course write your own plugin, as I have been this week. The plugins are written mostly in Ruby. My task was to create a plugin that exports AWS snapshot data to Graphite.
By mashing the aws checks with the metrics code found here, I was able to make a check to test and alert on the age of snapshots based on a filter.
def filters
    @filters = [
      {
        name: 'status',
        values: ['completed']
      }
    ]
    return if config[:filter_tag].nil?
    filters.merge!(
      [
        name: "tag:#{config[:filter_tag]}",
        values: [config[:filter_arg]]
      ]
    )
  end

resp = ec2client.describe_snapshots(
        filters: filters
      )
snapshot_time = snapshots.max_by { |my_snap| my_snap.start_time.to_i }
age_hours = (Time.now.to_i - snapshot_time) / 60
message = "Snapshot time is #{Time.at(snapshot_time)}"
if config[:critical_over] > 0 && config[:critical_over] >= age_hours
  critical message
end
By modifying the above code slightly, also turned it into a metric to be exported to Graphite.

Monitor servers to check they are alive
Let me know your experiences with monitoring and the tools that you use.
Previous Post: AWS Limits Next Post: email and alerts Tags: logging · monitoring · sensu