
email and alerts
13 May 2017 · Filed in InfrastructureFollowing on from last weeks post about monitoring, the next logical step is having the system create alerts when a threshold is breached.
Types of alert
Alerts comes a few shapes, most are expressed as a threshold of some metric that once breached, either too many or too little, sends an alert notification. There are a number of ways this can be achieved, email, sms, slack/irc or some status flashing on a wall board. There are pros and cons of each.

Do not spam with alerts
An old system of sending text messages through servers that can scan, delete, mark as spam and otherwise interfere with delivery of message. Even if the message should make it through those obstacles, it’ll probably be subject to the email client local rules to move it to the deleted items anyway.
SMS
A text message limited to 130 chars that is received by a mobile phone. Difficult not to notice, but can get expensive with large numbers of alerts.
Slack/irc/IM
IRC via a web interface, Slack or Flowdock for instance, enables the message to be seen by multiple parties on a ‘channel’.
Status board indicator
Should a wall board or other web page displayed on a video screen near you be practical. The changing of a green to a red square is sure to get management talking, unless all of it is red, it will be ignored.
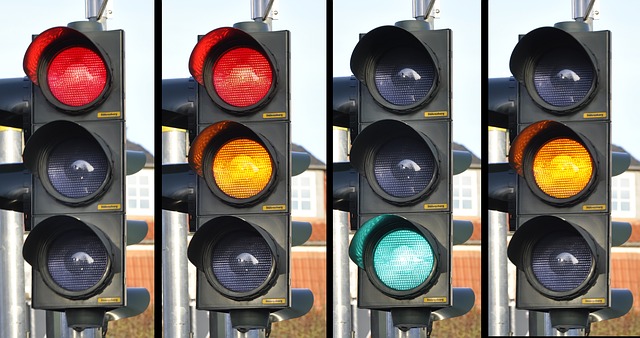
Red Amber Green status
A good alert
A service is usually made up of multiple components, and most of these should be redundant. I mean able to withstand a failure effecting a degraded service rather than an outage of that service. The point I am getting at here, is too often, the alerting system sends out far too many alerts, and this results in confusion or ignorance. Please be Very selective about alerts, and ONLY send those that truly need attention.
This relies on two points; The metric and automation
The metric
Is what you are monitoring the best metric to measure and a fair representation of the quality of service that needs human interaction? A metric is anything you can measure and is quantitative, e.g. CPU utilisation, Disk Input Output operations (IOPS), requests of a particular page, time taken to serve said page.
Dimensions
Dimensions are attributes of the data or could be thought of as a classification or filter, e.g. CPU number, which disk, URL of page. If you were going to plot the metric on a graph, the dimension would be a separate line on the same graph.
| DIMENSION | METRIC | METRIC |
|---|---|---|
| City | Sessions | Pages/Session |
| San Francisco | 5,000 | 3.74 |
| Berlin | 4,000 | 4.55 |
CPU is often used as a metric, but is CPU representative of the service delivery? With this metric in a monitored state, it could just send the metric dimension to a logging system such as grafana to display on a board or report. This gives insights into the performance of a component or service. Some metrics are more binary than that, for instance a service could have crashed and is therefore stopped and not serving anything, or a better example requiring humans, would be the physical failure of a hard drive that requires replacement.
This leads to;
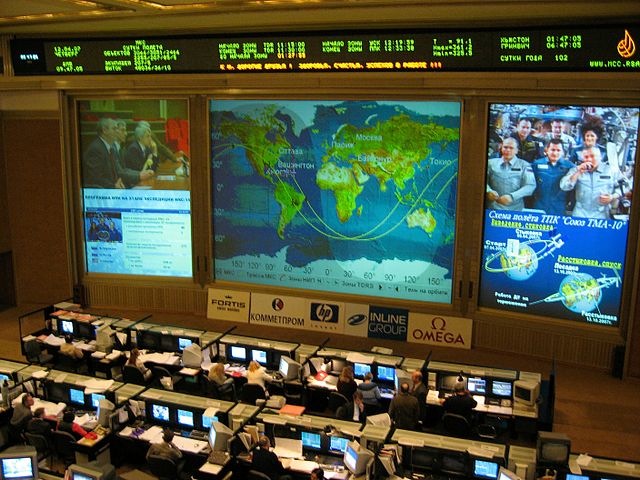
Control Centre Automation
Automation
Can the resolution be automated in some way, order a hard drive and create a ticket that tracks the status of the order. In terms of a service, this could be auto restarted. At a larger level, in an autoscaling group if the CPU breaches a certain threshold, a new instance is launched to deal with the extra load. Automatically and without staff to get involved, except for reporting afterwards to check the action was sensible.
Let me know your ideas to improve your own monitoring and alerting.
Previous Post: Monitoring Next Post: code quality Tags: alerts · email · monitoring